Fill Rate vs. Utilization: Running a Flex Clinician Network
With 1099 clinicians you don't assign shifts, you make shifts get chosen. Strict fill rate, the base-load/peaking-plant routing rule, the incentive-learning trap, and the six numbers we put on every flex operator's weekly review.
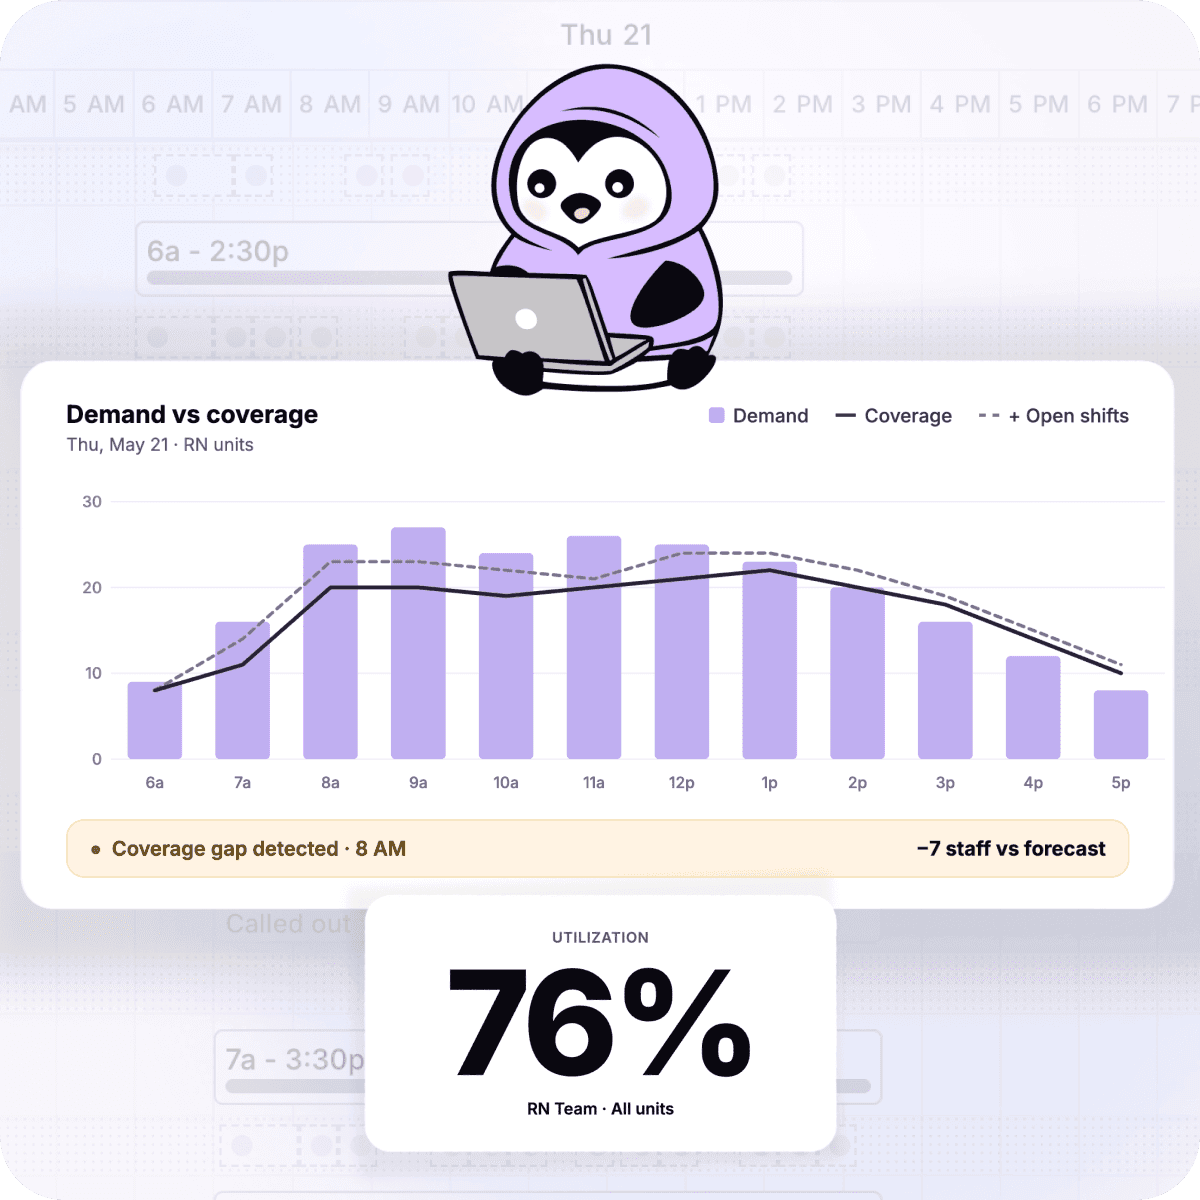
TL;DR: When you move from salaried clinicians to a flex or contractor network, the margin question flips from utilization (are paid hours producing visits?) to fill rate (is arriving demand met inside the access window?). The management model flips with it: you cannot mandate a 1099 clinician's schedule without building a misclassification case against yourself, so the levers left are marketplace levers. We define fill rate the strict way: qualified demand met within the access standard ÷ total qualified demand, by state and payer, weekly. "Eventually filled" does not count.
Fill rate vs. utilization, precisely
Utilization is supply efficiency: of the hours you paid for, how many became completed billable visits. It governs when labor cost is fixed. The failure mode is paying for emptiness.
Fill rate is demand capture: of the appointment demand that arrived, how much was met by an available, licensed, in-network clinician inside your access target. It governs when labor cost is variable. The failure mode is demand arriving and nobody picking it up: no wages lost, but the visit revenue, the patient's wait, the access breach, and eventually the patient and the contract.
The access window in that definition is doing real work. A behavioral health request filled in nineteen days against a ten-business-day standard is not a fill. We see networks report 95% fill on an "eventually filled" definition and breach their contracts the same quarter.
You don't schedule contractors. You make shifts get chosen.
Scheduling is control, and control is the core of every worker-classification test. Dictate a 1099 clinician's hours like an employee's and you are assembling the evidence for a reclassification that rewrites your entire cost model. This is the fact most flex playbooks skip past, and it changes the toolkit completely: with contractors, your instruments are which offers each clinician sees, how the hard slots are priced, and how fast claiming and getting paid is. That is marketplace operations. If your ops team is still thinking in rosters and assignments, the network will underperform no matter how good the clinicians are.
Hybrid routing: base load and peaking plant
Most real networks are hybrid, and the routing rule comes from power grids. Salaried clinicians are base load: predictable recurring demand, established panels, forecastable weekday volume routes to them first, because those hours are already paid for. The flex network is the peaking plant: surges, evenings and weekends, new-state launches, the variance you cannot forecast.
The expensive failure is running it backwards. Easy weekday demand drifts to contractors because the marketplace makes it convenient, salaried clinicians sit at 65% utilization, and you pay twice: idle employed hours plus per-visit contractor fees. Both dashboards look defensible in isolation. The tell is one line: if employed utilization is below target while flex spend is growing, your router is broken. We put that check on the weekly review of every hybrid network we work with.
Raising fill rate without overpaying for it
- Predict the gap before it exists. Cell-level forecasting flags which shifts go short days ahead. An open-shift offer sent four days early is an option. One sent the morning of is a ransom.
- Target the offer. Blasting the full roster trains everyone to ignore you. Offers route to clinicians licensed and enrolled for that exact state-payer cell, historically responsive at that hour, and not trending toward overload.
- Watch for incentive learning. Escalating bonuses fill hard shifts, and a marketplace learns: if waiting 24 hours reliably adds $40, your supply will wait, and you will have taught your own network to hold out. The counters are caps, escalation only on model-predicted shortfall shifts rather than every aging shift, and base offers attractive enough that early claiming wins. Incentive spend per filled shift should trend down as targeting improves. If it trends up at flat volume, the network is gaming the ladder.
- Treat clinician experience as supply retention. Contractors multi-home. Their hours concentrate wherever offers are relevant, claiming is one tap, and pay is fast and right. Every payment error is a fill-rate problem arriving on a delay.
Why fill rate hides
Two reasons. Averages: a 92% network fill rate can hide 99% in your big compact states and 60% in the three states a new contract just made strategic, and the contractual damage lives entirely in the hidden cells. And invisible demand: the patient who could not find an appointment inside the window never becomes a tracked unfilled slot. She becomes a booking that never happened, a conversion that died in a funnel you paid to fill. Without estimating latent demand from search, signup, and abandonment data, your dashboard undercounts the problem by design. Reconstructing true fill rate by state at quarter close, which is where most teams are today, means managing last quarter's network.
The six numbers we put on a flex operator's weekly review
- Fill rate within the access window, by state and payer, against each contract's standard.
- Offer-acceptance rate, the leading indicator. Fill rate breaks weeks after acceptance starts sliding; by the time fill rate moves, your supply has already drifted to another platform.
- Time-to-fill and the share of shifts requiring escalation.
- Incentive spend per filled shift, trending down or you are training hold-outs.
- Employed-core utilization, the double-pay alarm.
- Active supply depth per state-payer cell: distinct clinicians who claimed a shift there in 30 days. A cell served by two contractors is one vacation away from a breach.
How we run it
Untether runs forecasting, licensure-aware matching, and open-shift management as one system, so employed and flex capacity schedule against the same demand picture, incentives land only on predicted shortfalls, and fill rate by state is on a screen this week instead of in a postmortem next quarter. Book a demo and we will show you your real fill rate, including the demand you are not currently counting.